Most advanced stock analysis platform in India with quant-first, AI-last philosophy.
Our proprietary signal system is market-tested and continuously evolving.
“We built a scoring engine that tells you if a stock is cheap for its sector, a risk firewall that catches manipulation before headlines, and signals validated against real outcomes. The system learns from market feedback and recalibrates itself. Ask any question — get answers without hallucinations.”
NSE-listed companies analyzed daily
Each with calibrated thresholds
Fine-grained peer comparison
API response time
A complete equity research operating system
Analysis Engine
- Sector-calibrated thresholds
- 8-quarter trajectory analysis
- 141 subsector peer groups
Risk Intel
- Forensic manipulation detection
- Multi-level risk scoring
- A-F risk grades with rationale
Market Intel
- Factor performance dashboard
- Market regime detection
- Grade migration tracking
Signal System
- 8 divergence patterns
- 60-day outcome tracking
- Segment-based gating
Cohort Engine
- Portfolio & watchlist analysis
- Sector & subsector views
- Index & fund decomposition
Universal Chat
- Natural language queries
- Context-aware responses
- Pre-computed grounding
EquityScore vs Typical Indian Stock Platforms
“We're not a data terminal. We measure whether quality filters and signals actually add edge — then turn it into a workflow: screen → explain → refine.”
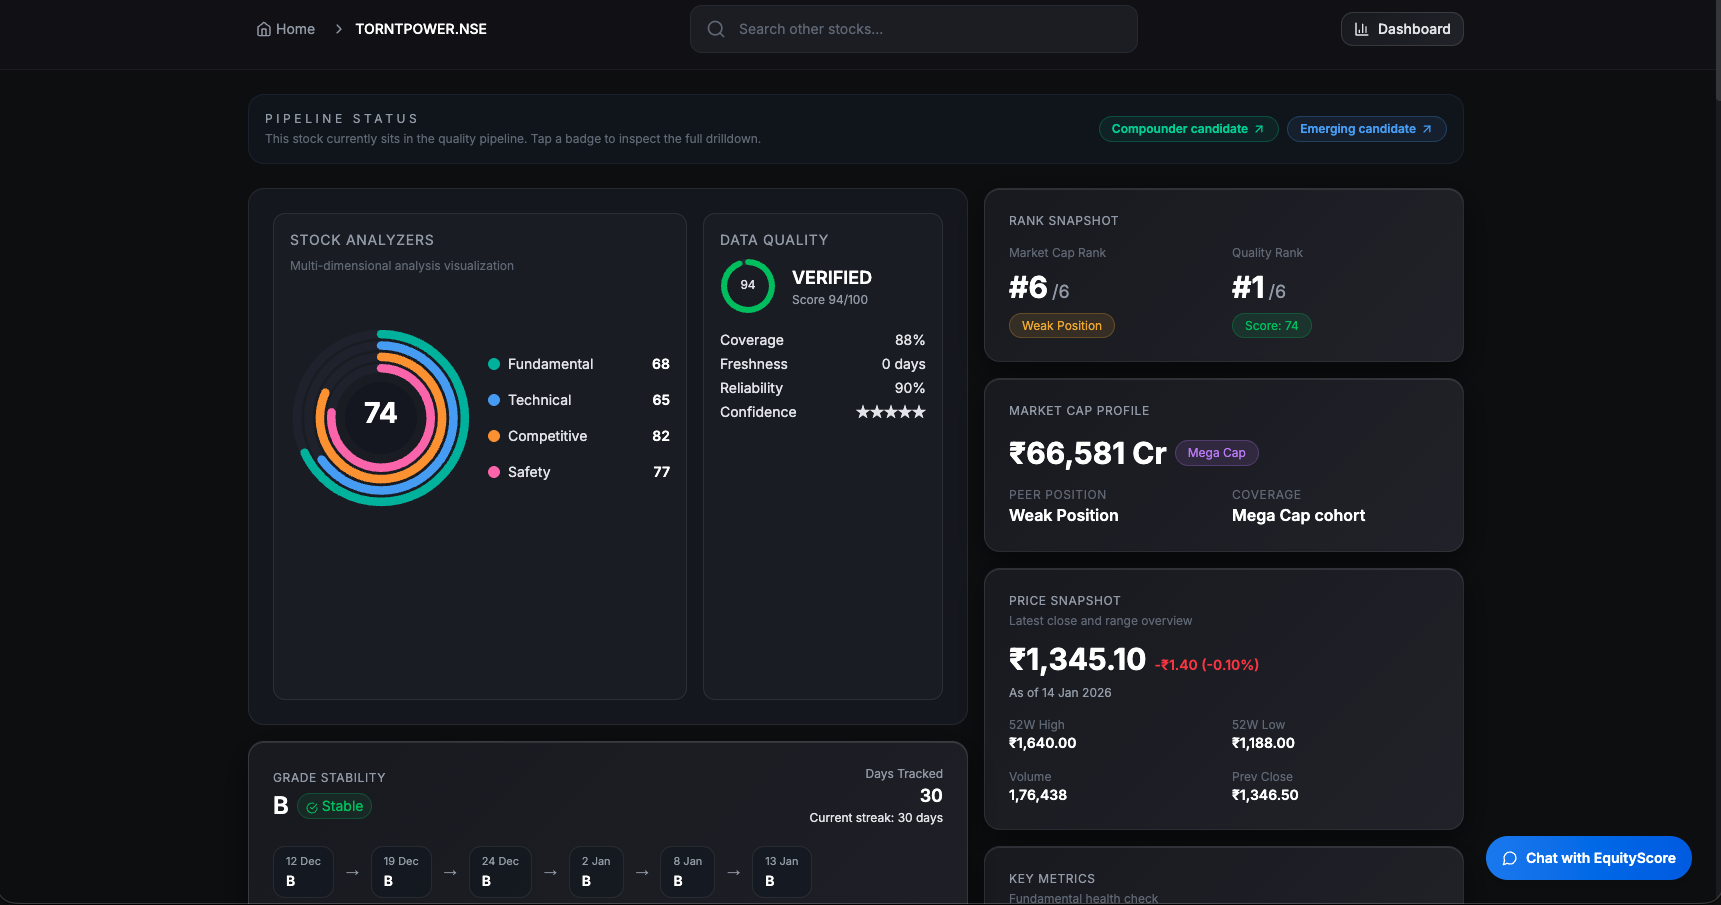
Multi-dimensional scoring with 5 analyzer modules and data quality verification
Built on validation, not claims
What works stays. What doesn't gets turned off.
Grade evidence
- ✓Latest reviewed 90-day windows show cleaner grade separation than noisy short-horizon checks.
- ✓Current grades are treated as the decision anchor; transitions are review events, not standalone trading calls.
- ✓Evidence windows are refreshed as forward outcomes mature and reviewed before stronger claims are used.
Report-only evidence; historical windows do not guarantee future returns.
Signal discipline
- ✓Signals explain risk, opportunity, and drift, but do not override the grade unless promoted by evidence governance.
- ✓Research overlays such as QV, OAS, BCG, and Hidden Gems stay caveated until their own gates pass.
- ✓Tracker and audit artifacts monitor drift, freshness, and evidence status before claims move into product language.
Signals remain contextual unless the Evidence Registry marks the claim as promotable.
“In stressed markets, we focus on two things: avoid landmines and buy quality only when it's mispriced.”
Want to see the full analysis? Read the latest market-first evidence note →